This is the crowning glory of runtime analysis for native C/C++ applications. Runtime analysis can not only help to detect problems by displaying performance, memory, thread, and code coverage data in different views, but it can also pinpoint the exact location in the user code where the error is generated and/or caused. Runtime memory corruption detection is essential to ensure proper functioning and high quality of native C and C++ applications on all platforms. The UNICOM tool for runtime memory error detection is Purify. Again, let's look at some examples.
Error detection example 1: Purify memory error and memory leak reports
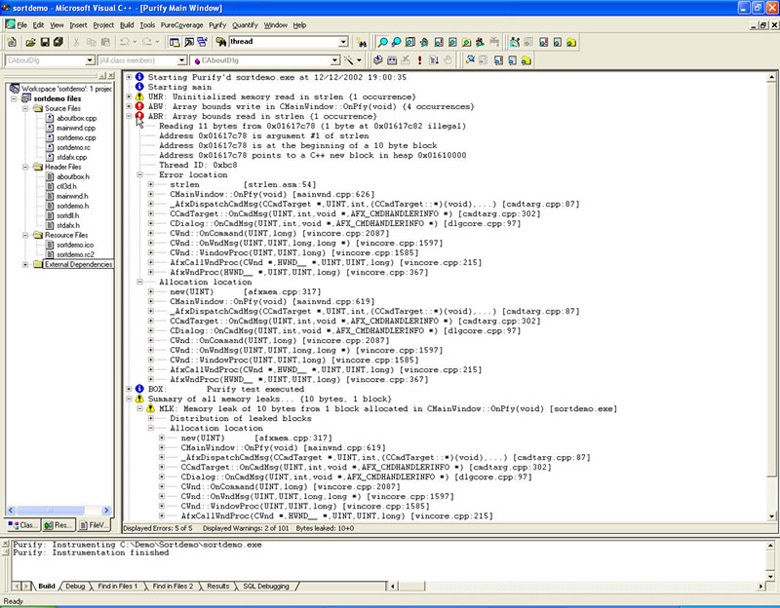
Purify can pinpoint the exact line of code where a developer has created a memory error. It doesn't even need source files to provide this information; Purify detects errors in memory and uses debug information to trace these errors back to the responsible lines of code (Figure 8).
In this particular example, the developer forgot to take the termination string into consideration when building an array variable. This error was causing the release build of the application to crash, whereas the debug build worked fine. This example is just one of the many ways in which runtime analysis significantly reduces debugging time for C/C++ development.
 Figure 8: Purify memory error and memory leak report for a Visual C++ application
Error detection example 2: Quantify annotated source
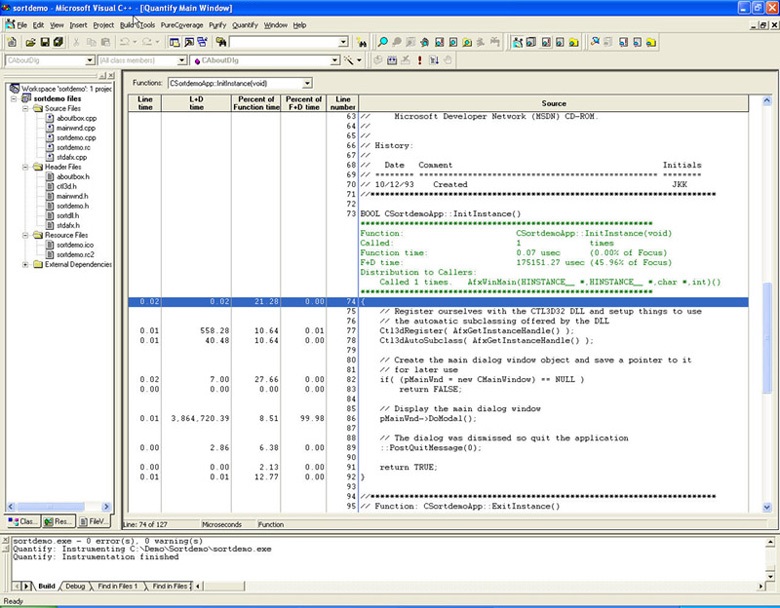
Quantify has a unique capability to measure distribution of time recorded for each of the user methods per line of code. Quantify annotated source displays times measured for each line of code, along with time spent inside functions called on the line. This information can help you narrow the performance bottleneck down to an individual line of code.
 Figure 9: Quantify annotated source for a mixed visual Basic 6 and Visual C++ application in Visual Studio 6
Error detection example 3: Purify object and reference graph
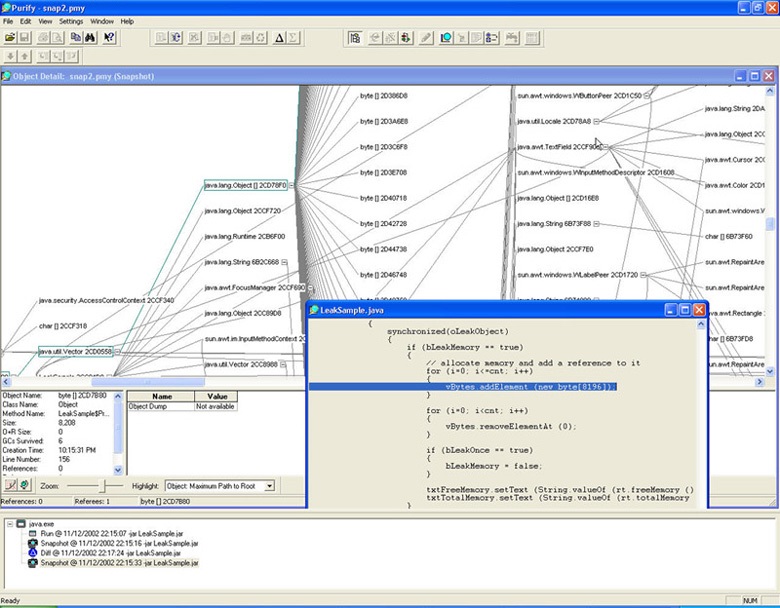
In Java and .NET managed code, it is not possible to make runtime memory errors such as out of bounds reads and writes and free memory reads and writes, because the automatic memory management in the runtime subsystem prevents developers from directly accessing allocated memory. However, this automated memory management doesn't prevent programmers from forgetting references to the objects' allocated memory. As long as there is a reference to such dynamically allocated objects somewhere in the code, they will stay in memory and will not be cleaned by the automatic memory management (garbage collector). The net effect of such errors is the same as the effect of C/C++ leaks: The memory becomes unavailable for this and all other processes running on the host operating system. By doing a runtime analysis with Purify, however, you can pinpoint the exact line of code where the reference to the object in question has been created.
 Figure 10: Purify object and reference graph for a Java application
Related products, solutions and news