Yet another way to leverage runtime analysis is by documenting the application's runtime behavior for future use. This helps you assess the overall quality of the project and measure the influence of newly introduced features and code changes on overall application performance, reliability, and test harness completeness. This advanced way of practicing runtime analysis involves collecting runtime data for each iteration of the component or application under development and analyzing the data at different stages in the project lifecycle. This information can help in determining overall project quality as well as the effect of new feature additions and bug fixes on overall quality.
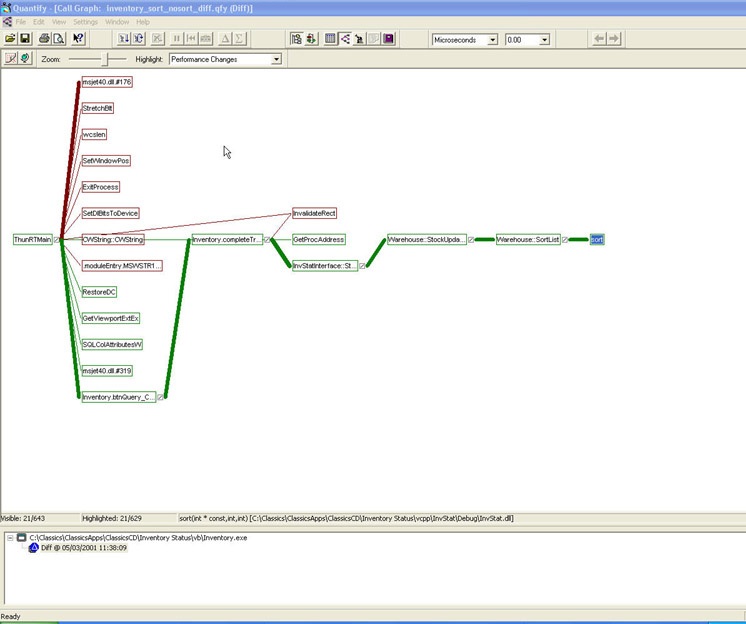
Advanced runtime analysis tools such as PurifyPlus provide features to analyze multiple test runs by, for example, allowing the user to merge code coverage data from various tests or test harnesses, or to create separate data sets for comparisons of consecutive iterations of test measurements, as shown in Figure 11.
In Figure 11, Quantify compares two data sets and highlights chains of calls where performance has improved (green line) and chains of calls where performance has dropped (red line). The calculated data is available in both the call graph view and in the more detailed function list view.
 Figure 11: Quantify compare runs report
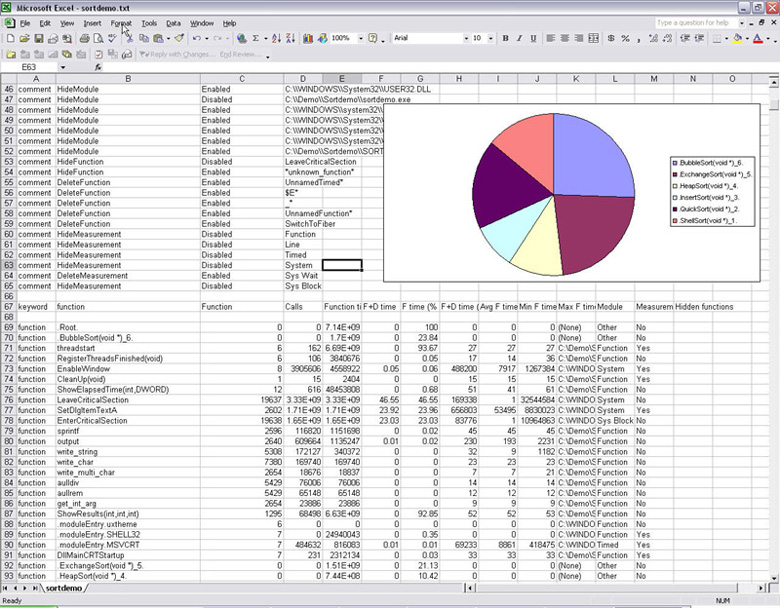
Even if you are not in a position to create an automated test environment, you can still automate data analysis by taking advantage of runtime analysis data saved as ASCII files. Figure 12 shows an example of a performance profile imported into Microsoft Excel.
You can easily automate data analysis in Excel by creating simple Visual Basic applications, or with any of the popular scripting languages: Perl, WSH, JavaScript, and so on. PurifyPlus for UNIX comes with a set of scripts that can help you manage and analyze data collected from various tests.
 Figure 12: Quantify performance report imported into Excel
Related products, solutions and news