Determine the optimal projects
How does your organization manage its on-going and planned project portfolio? How do you make sure that projects are aligned with company objectives and strategies? What is in the project portfolio? Does the portfolio include the projects that bring the most value to your company? Do the projects align with customer and internal-stakeholder requests and market demand? How well are your projects performing? What risks do you face? Have you chosen the best and most important projects to the business?
With UNICOM® Focal Point™ you can gain a 20,000-foot view of on-going and planned projects in the organization. Therefore, gaining visibility into each project's total expected cost, consumption of resources, expected timeline, benefits to be realized, and interdependencies with other projects in the portfolio. This allows an optimum mix of projects to be selected and approved while aligning them with business priorities.
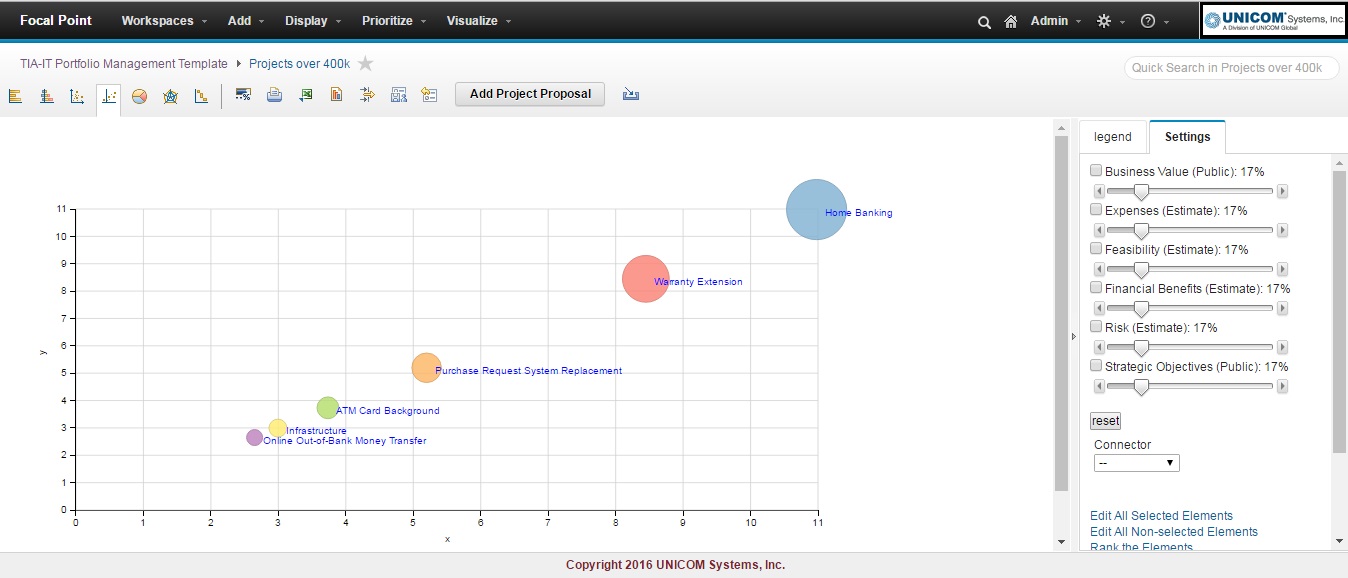
 Bubble chart shows all projects over $400k, ranked by feasibility, business value - and the size of the bubble in this case equaling expenses
Web-based team contributions
UNICOM® Focal Point™ is a web-based solution with an underlying database repository, enabling people across your organization to enter and access project information based their role. Project templates can be customized to be specific to each organization or department. It can be integrated with and import data from other applications or solutions for project management and the PMO. Configurable workflows enable teams to submit project proposals, provide information to the project, and send it through reviews and an approval based on your business process. Projects can be aligned to business objectives, strategies, capabilities, demands, services, applications, technologies, and other aspects of the business.
Trade-off analysis
UNICOM® Focal Point™ enables you to perform trade-off analysis of projects by using best-in-industry approaches such as pair-wise comparison, stacked bar charts with ranking schemes, and bubble charts. You can automatically determine net benefits of projects using adjustable weighting for different positive and negative criteria. You adjust the weighting of positive and negative criteria to do 'what-if' scenario analysis. This process provides understanding of the value of projects while estimating the cost of tradeoffs so that projects are set up for success and operate within resource, financial, and time constraints.
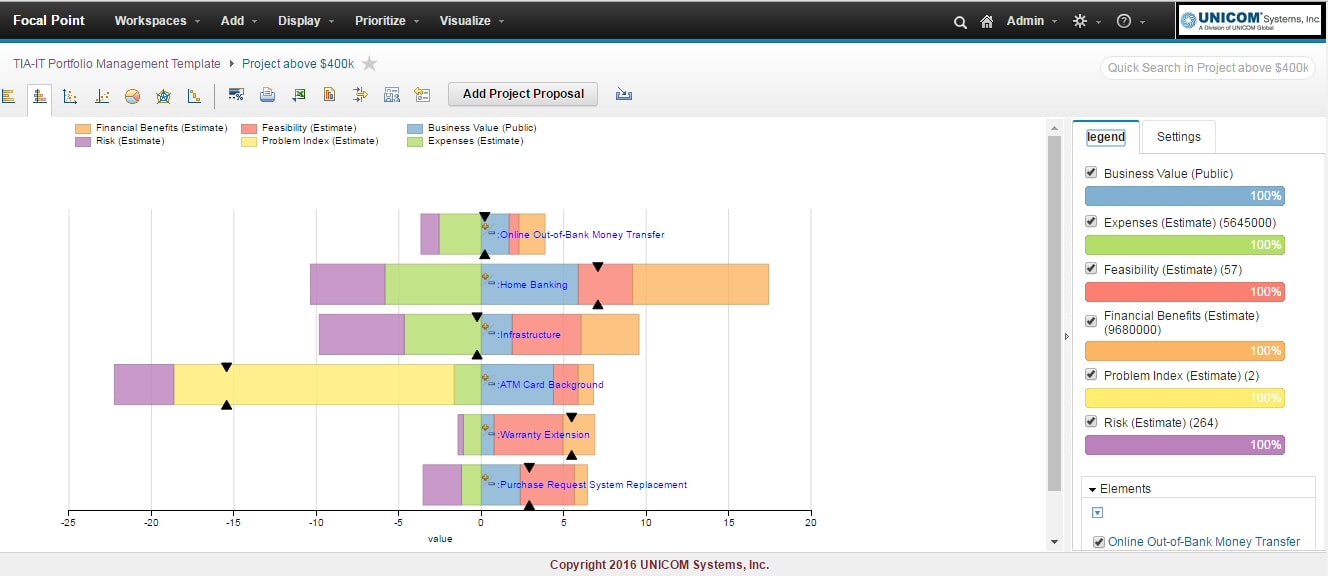
 Stacked bar chart showing projects automatically stacked (ranked) from highest to lowest priority based on totaling of positive (right of y axis) and negative (left of y axis) variables
Perform resource management
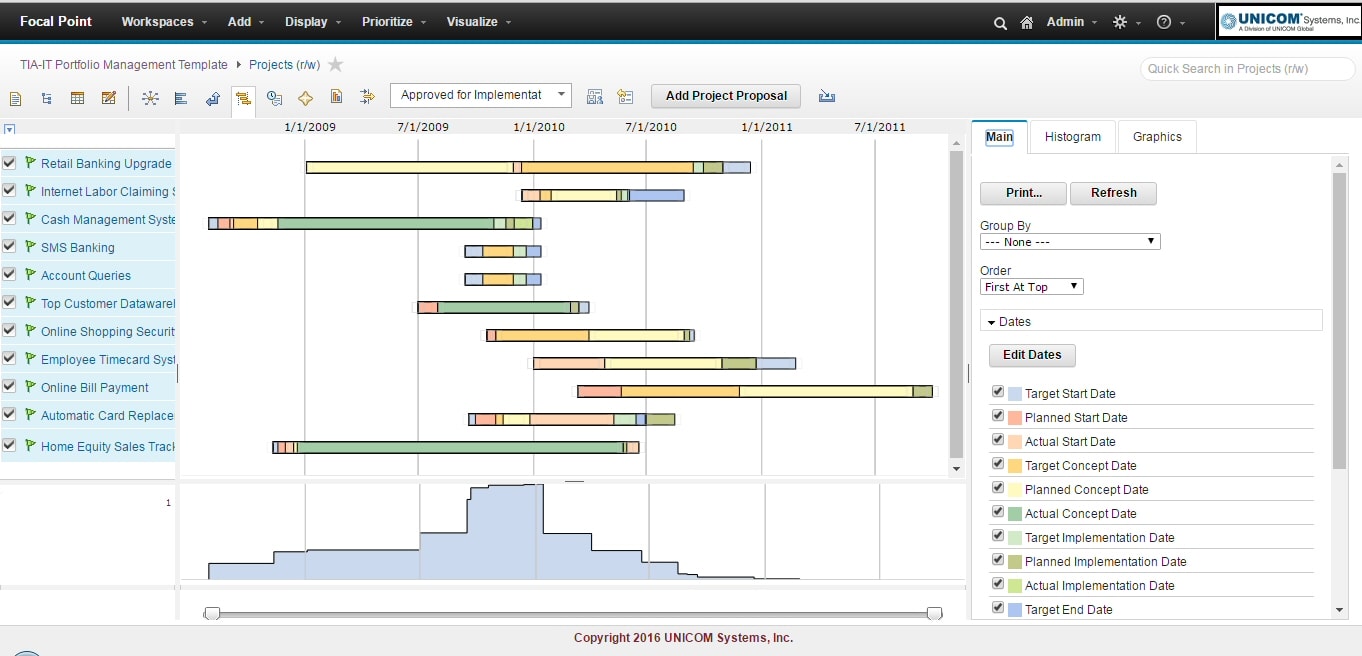
UNICOM® Focal Point™ enables you to specify and track resources assigned to projects. You can then view groups of projects in a timeline mashed against a resource-utilization histogram to red flag over-utilization issues that will cause bottlenecks. This allows you to perform more effective resource allocation, so that you can align development decisions with your overall business strategy.
 Roadmap of projects plotted against time over histogram of resources available
Benefits
UNICOM® Focal Point™ enables you to:
- Centralize project information key to decision making, status reporting, and reviews. This collaborative platform helps reduce the chaos of managing project portfolio information using emails, documents, spreadsheets, and isolated project tools
- Determine a project's Net Present Value (NPV) and understand the impact of risk and uncertainty surrounding these values
- Prioritize projects and groups of projects using qualitative and quantitative analysis and key performance indicators (KPIs)
- Automatically determine net benefits of projects, using adjustable weighting for different positive and negative criteria
- Perform trade-off analysis of projects using best-in-industry approaches such as pair-wise comparison, stacked bar charts with ranking schemes, and bubble charts
- Perform 'what-if' analysis using adjustable ranking schemes for stacked bar charts
- Show resource utilization of a set of projects across a timeline
- Determine bottlenecks due to over utilization of resources. Perform more effective resource allocation, so you can align development decisions with your overall business strategy
- Determine the interaction and effect of a project sequence on revenue, costs and resources. Now you can quickly align and adjust road maps as business and marketplace needs change
- Focus on managing value and change to create true business value
